
Commenting on export figures of the chemicals industry in September, Chairman of Board of the Istanbul Chemicals and Chemical Products Exporters’ Association (İKMİB), Adil Pelister said: “Export value of our chemical industry reached 2.2 billion dollars in September. I can say that we started to see the reflection of many factors such as the decline in global demand, wars in our nearby geography, inflation and exchange rate balance, and the increase in input costs on September figures. Despite this, we continue to make the highest contribution to the national economy as the second highest exporting industry in Türkiye. However,
when we consider the data for the first nine months, there is a 4.2 percent growth in our chemical sector exports. Our exports in the January-September period reached 23.1 billion dollars. Our exporters need more support in accessing financing in this difficult period. We expect the support and incentives of our Economic Management in this direction. Despite all the difficult conditions, we will continue to work to increase our exports.”
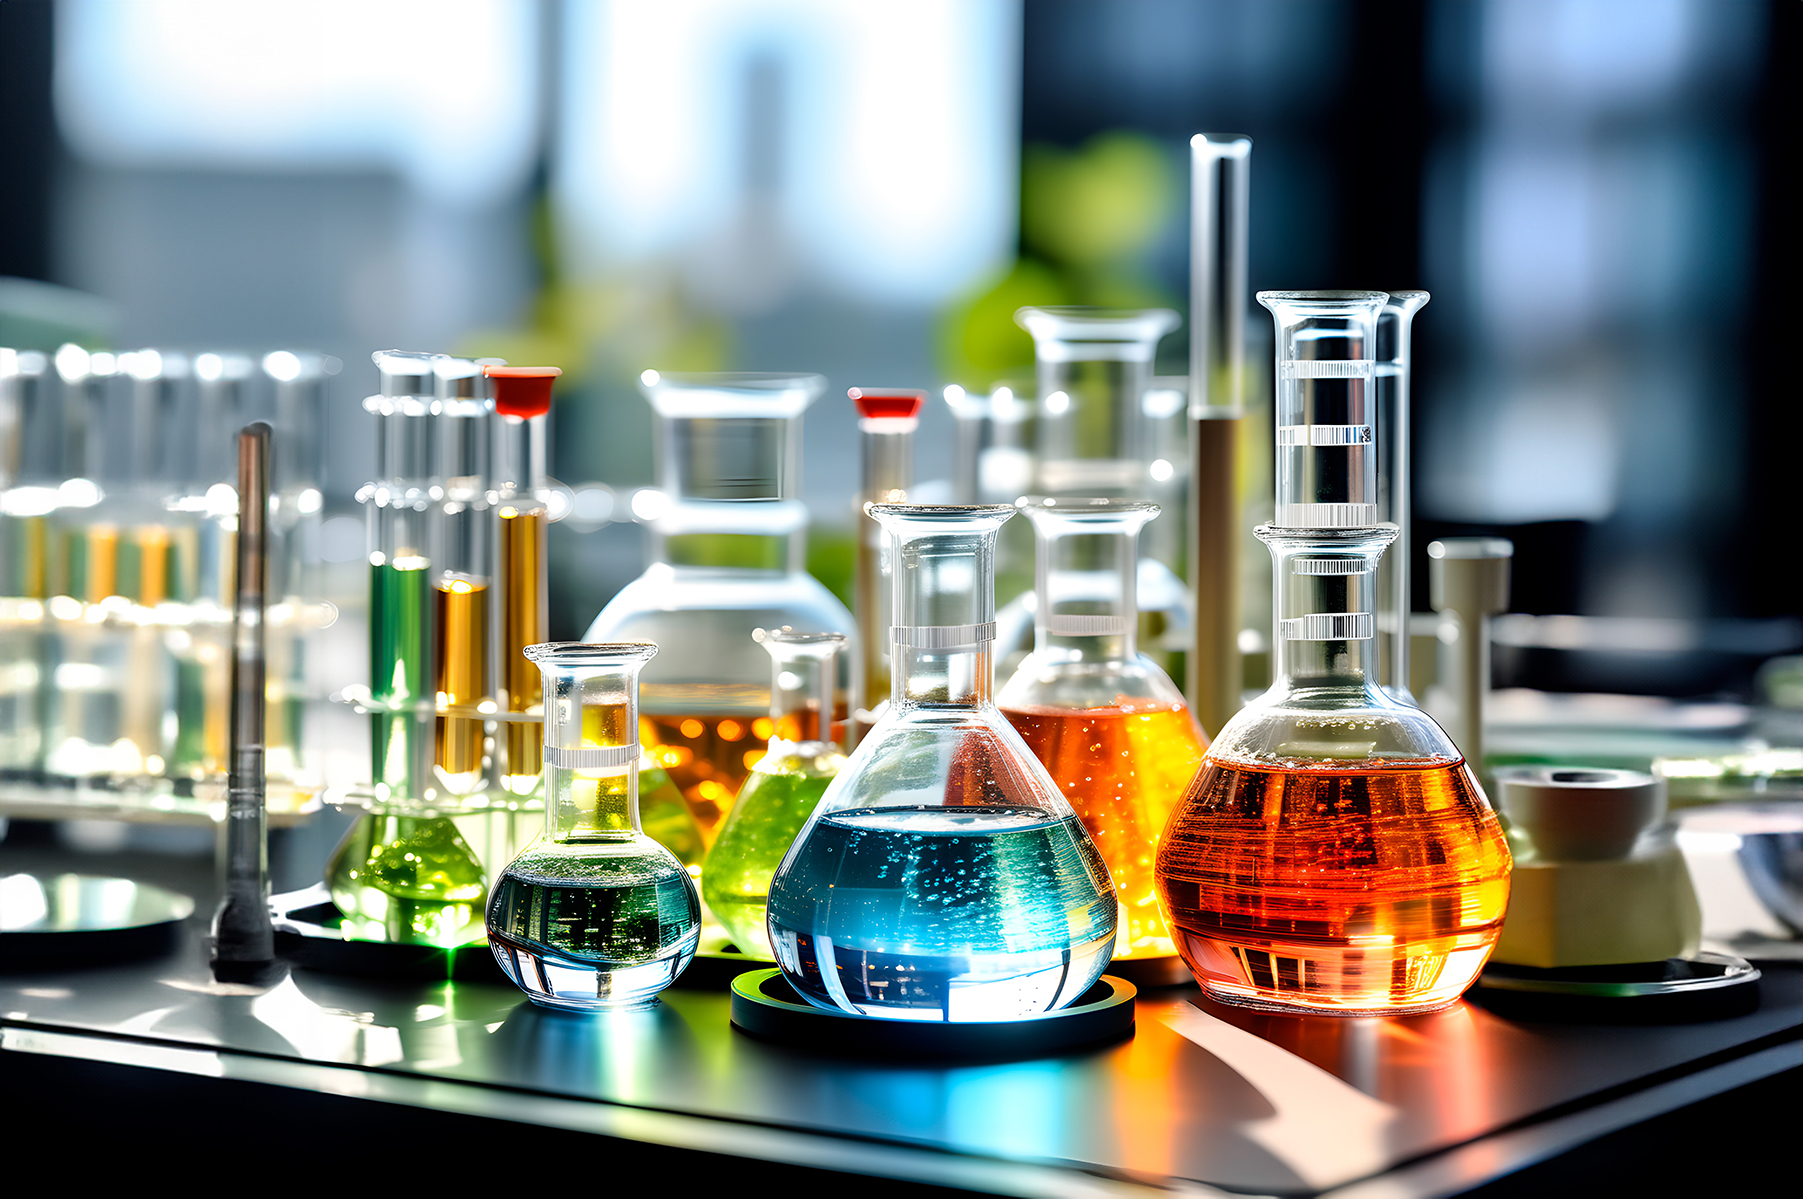
“Plastics and products” was the highest exported product group in September
Plastics and products became the highest exported chemicals and products product group in September with an export value of 822 million 449 thousand dollars. The second group was mineral fuels and products with an export value of 245 million 517 thousand dollars while inorganic chemicals occupied the third place with an export value of 224 million 737 thousand dollars. ‘Inorganic chemicals’ were followed by ‘essential oils, cosmetics and soap’, ‘rubber, rubber products’, ‘paint, varnish, ink, and products,’, ‘pharmaceuticals,’ ‘miscellaneous chemical agents,’ ‘cleaning products,’ and ‘fertilizers’ in the top ten.
Russia was the highest receiver of exports in September with 139 million dollars of export value. The top ten receiver of exports in September were Russia, Holland, Iraq, Germany, USA, Italy, Romania, Spain, England, and Greece. The highest increase in September among the top 10 countries was achieved to Greece with 64.48 percent.
Monthly chemicals export in 2024
| MONTH | 2023 VALUE ($) | 2024 VALUE ($) | DIFFERENCE (%) |
| January | 2,299,003,029.07 | 2,367,141,343.68 | 2.96% |
| February | 2,261,956,042.17 | 2,617,131,372.38 | 15.70% |
| March | 2,879,962,087.77 | 3,076,856,995.48 | 6.84% |
| April | 2,381,533,446.92 | 2,495,758,684.07 | 4.80% |
| May | 2,438,874,096.65 | 3,015,547,577.00 | 23.65% |
| June | 2,383,546,414.36 | 2,235,009,229.10 | -6.23% |
| July | 2,172,784,497.27 | 2,584,451,724.13 | 18.95% |
| August | 2,657,796,453.53 | 2,565,627,014.11 | -3.47% |
| September | 2,772,562,091.35 | 2,213,410,996.92 | -20.17% |
| TOTAL | 22,248,018,159 | 23,170,934,937 | 4.15% |
Highest receivers of Turkish chemicals exports in September 2024
| NUMBER | Country | SEPTEMBER 2023 VALUE ($) | SEPTEMBER 2024 VALUE ($) | DIFFERENCE (%) |
| 1 | RUSSIA | 142,229,396.00 | 139,273,689.61 | -2.08% |
| 2 | HOLLAND | 254,206,539.66 | 122,823,059.82 | -51.68% |
| 3 | IRAQ | 89,915,902.96 | 102,948,759.37 | 14.49% |
| 4 | GERMANY | 98,338,963.63 | 98,143,348.10 | -0.20% |
| 5 | USA | 74,607,496.62 | 87,221,156.25 | 16.91% |
| 6 | ITALY | 166,027,238.93 | 84,017,339.76 | -49.40% |
| 7 | ROMANIA | 183,854,000.08 | 83,760,760.21 | -54.44% |
| 8 | SPAIN | 61,684,022.65 | 73,880,755.89 | 19.77% |
| 9 | ENGLAND | 64,998,925.83 | 73,721,915.84 | 13.42% |
| 10 | GREECE | 32,872,304.24 | 55,712,177.67 | 69.48% |
Sub-industry of chemicals exports in September 2024
| 2023 -2024 | |||
| SEPTEMBER 2023 | SEPTEMBER 2024 | % DIFFERENCE | |
| PRODUCT GROUP | (VALUE $) | (VALUE $) | VALUE |
| PLASTICS AND PRODUCTS | 778,235,229 | 822,449,098 | 5,68% |
| MINERAL FUELS, MINERAL OILS AND PRODUCTS | 913,660,280 | 245,517,058 | -73,13% |
| INORGANIC CHEMICALS | 215,480,051 | 224,737,917 | 4,30% |
| ESSENTIAL OILS, COSMETICS AND SOAP | 174,866,027 | 186,532,463 | 6,67% |
| RUBBER, RUBBER PRODUCTS | 138,752,396 | 132,561,321 | -4,46% |
| PAINT, VARNISH, INK AND THEIR PRODUCTS | 126,539,894 | 131,690,636 | 4,07% |
| PHARMACEUTICALS | 119,663,809 | 116,730,121 | -2,45% |
| MISCELLANEOUS CHEMICAL PRODUCTS | 94,383,077 | 103,933,345 | 10.12% |
| CLEANING PRODUCTS | 74,319,503 | 84,370,228 | 13.52% |
| FERTILIZERS | 10,094,651 | 66,120,328 | 555.00% |
| ORGANIC CHEMICALS | 82,946,459 | 52,399,058 | -36.83% |
| ADHESIVES, GLUES, ENZYMES | 39,436,674 | 42,945,163 | 8.90% |
| GUNPOWDER, EXPLOSIVES AND THEIR PRODUCTS | 2,267,788 | 2,218,391 | -2.18% |
| PHOTOGRAPHY AND CINEMATOGRAPHY PRODUCTS | 1,548,508 | 1,019,437 | -34.17% |
| GLYCERIN, HERBAL PRODUCTS, DEGRAS, FATTY PRODUCTS | 274,523 | 179,117 | -34.75% |
| PROCESSED AMIANT AND MIXTURES, PRODUCTS | 93,224 | 7,315 | -92.15% |
| TOTAL | 2,772,562,091 | 2,213,410,997 | -20.17% |


